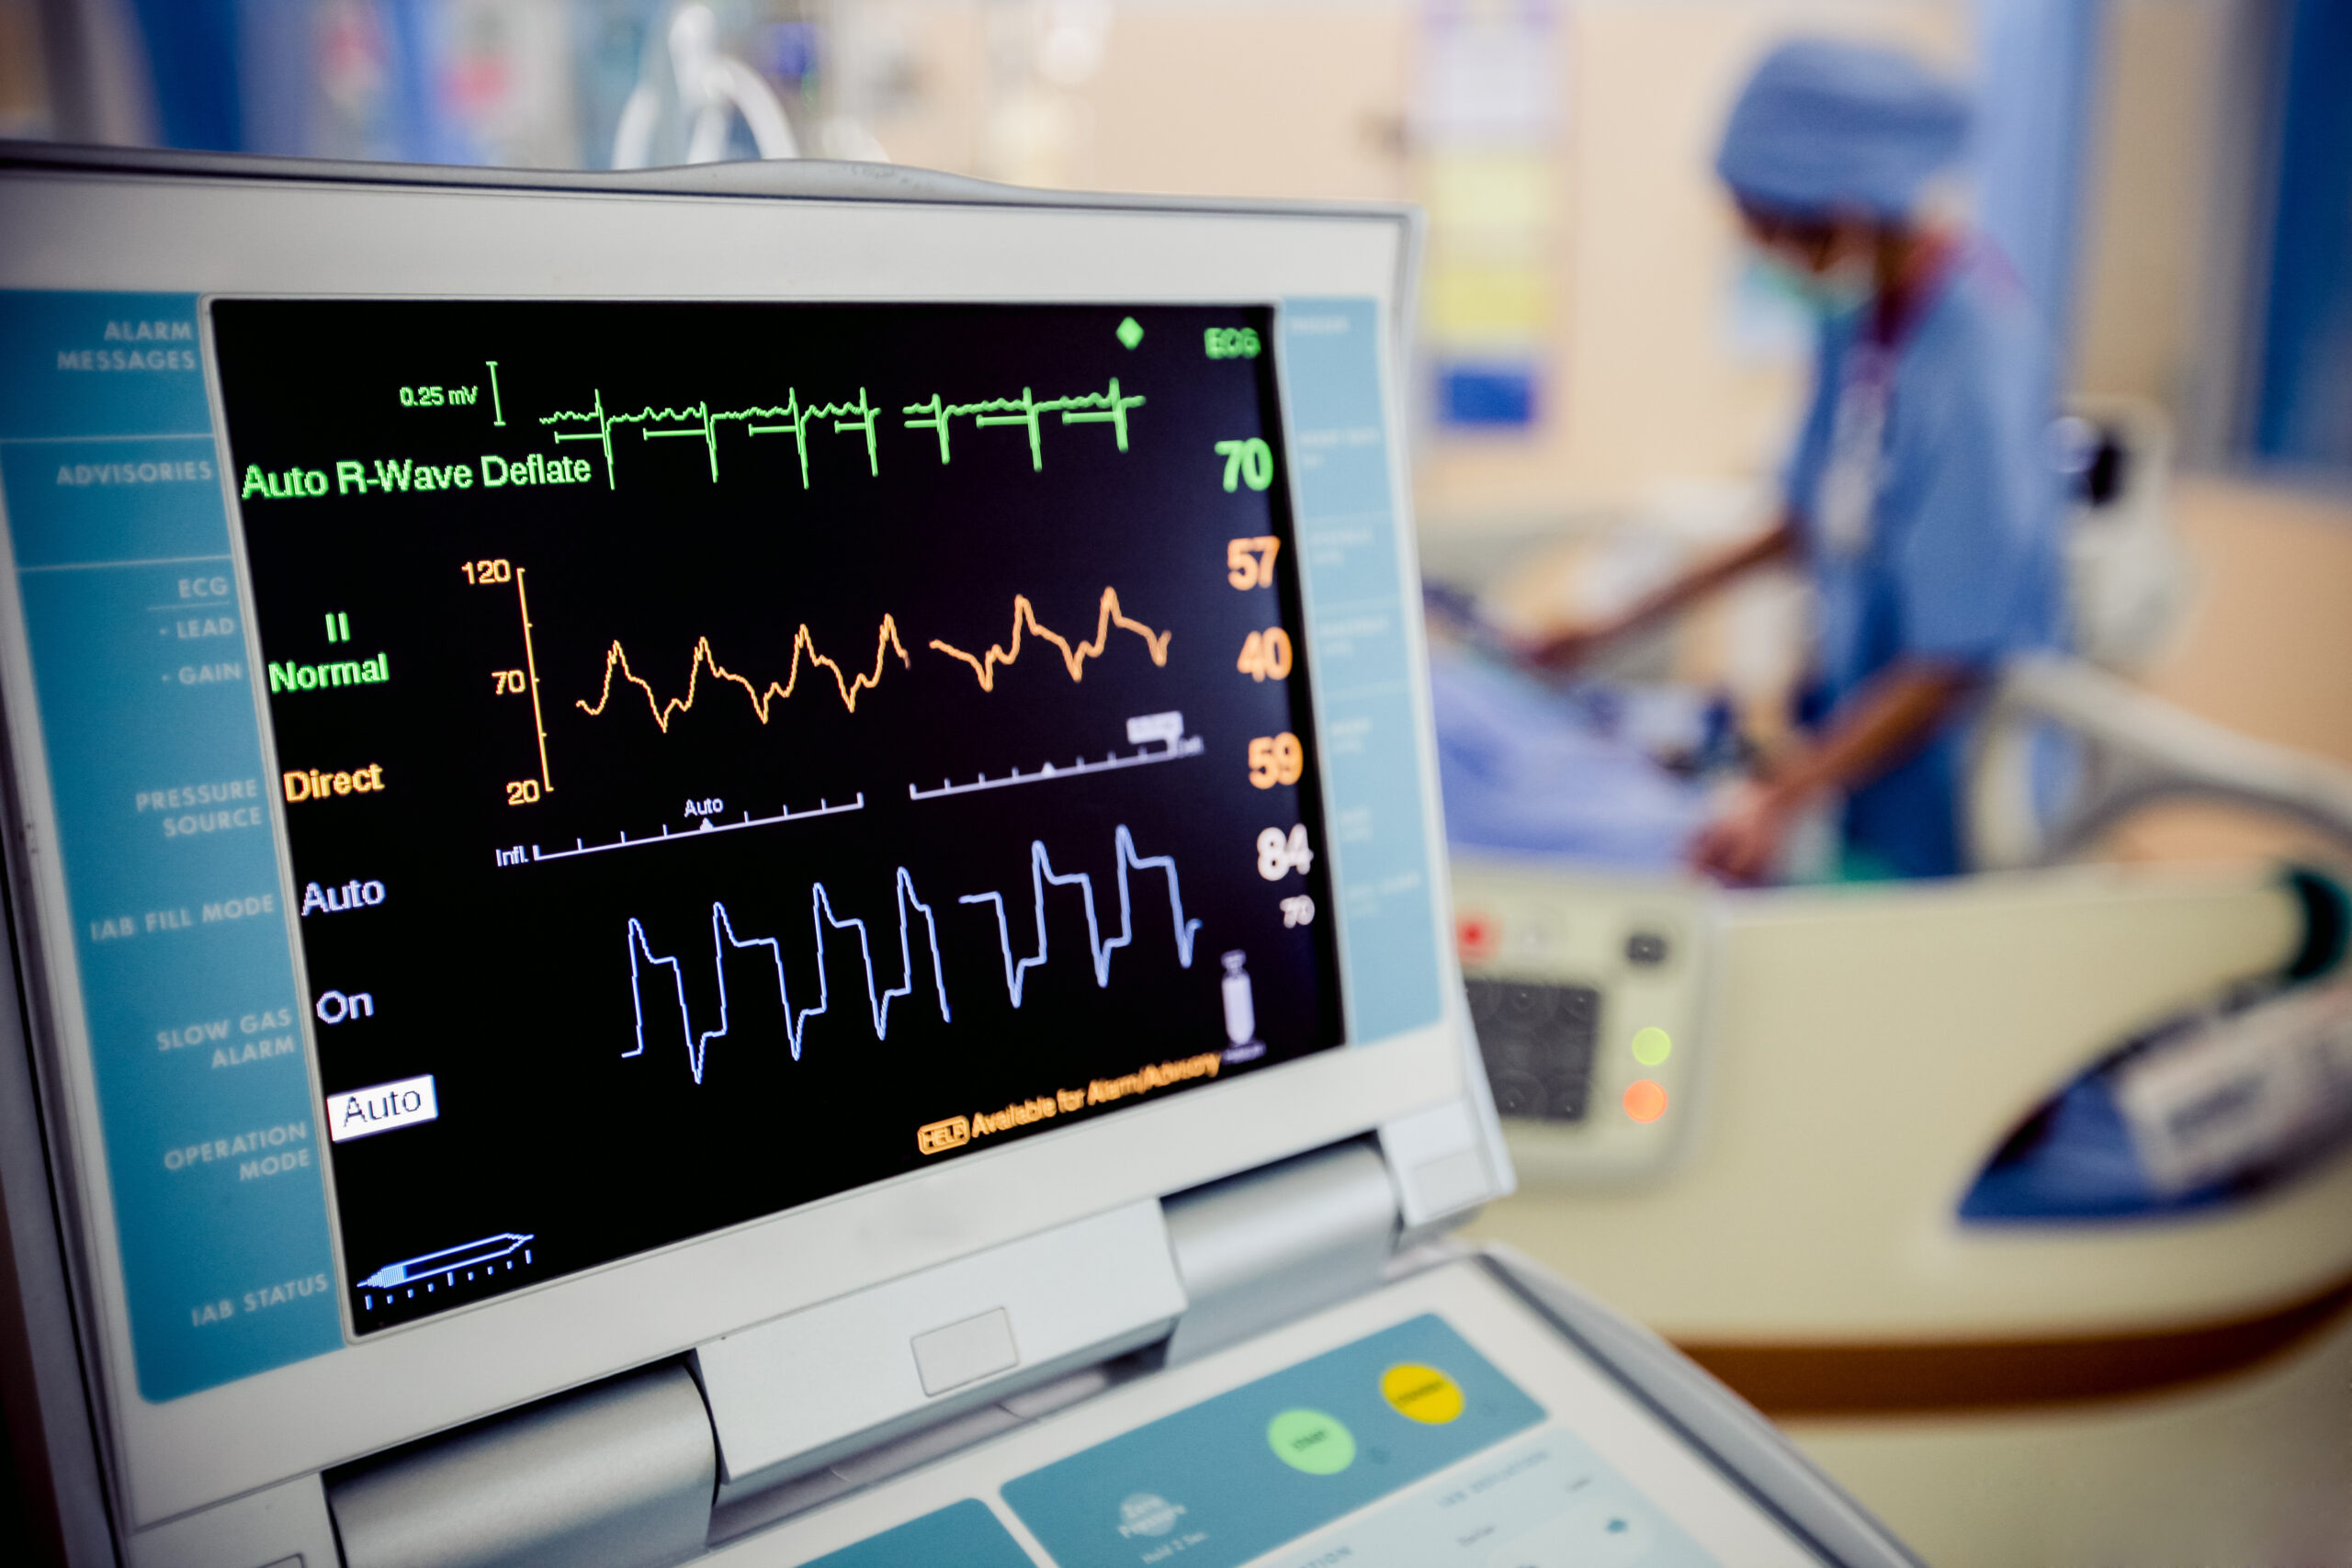
Reading an ECG (electrocardiogram) report can feel intimidating if you’re not from a medical background. But with heart health becoming a top priority, especially for those at risk of cardiac conditions, understanding the basics of ECG reporting is an empowering step for patients. Heartnet, a leader in real-time heart monitoring, helps make sense of these vital signs so individuals can take a proactive approach to their cardiovascular health.
What is ECG Reporting and Why Is It Important?
ECG reporting is the process of recording the electrical activity of the heart to detect abnormalities in rhythm, rate, and structure. This diagnostic tool is crucial in identifying arrhythmias, heart attacks, and other cardiac issues early. As part of routine screenings or in response to symptoms like chest pain or palpitations, ECGs provide real-time insights into heart function.
For patients, understanding what an ECG captures can reduce anxiety and improve communication with healthcare providers. It bridges the gap between complex cardiology data and personal health decisions.
Breaking Down the ECG Report: What Do the Waves Mean?
An ECG report typically includes a graph showing waves labeled P, QRS, and T. Each wave represents a different phase of the heart’s electrical cycle:
- P Wave: Atrial contraction (when the upper chambers pump blood to the lower chambers).
- QRS Complex: Ventricular contraction (the main pumping action to the body and lungs).
- T Wave: Recovery phase, when the heart resets for the next beat.
Key metrics on the report—such as heart rate, PR interval, and QT interval—help doctors determine whether the heart’s electrical conduction is normal or shows signs of concern. With real-time heart monitoring systems like those from Heartnet, this data is continuously analyzed, enabling quicker intervention and better long-term management.
Practical Tips for Reading Your ECG Report
While ECG interpretation is best left to professionals, here are a few pointers to help patients get familiar with their reports:
- Check the Heart Rate: Normal is between 60-100 bpm. Too low or too high may indicate a problem.
- Regularity of Rhythm: A consistent pattern usually suggests normal sinus rhythm.
- Intervals and Durations: Short or prolonged intervals can point to conduction issues.
- Note Any Flags: Many digital ECGs highlight areas of concern automatically.
Patients using Heartnet’s real-time heart monitoring tools benefit from user-friendly interfaces that help visualize ECG data and trends, making reports easier to interpret even for beginners.
Read more: How Remote Monitoring Is Changing Heart Health in India
Real-Time Monitoring: Empowering Patients Through Awareness
Heartnet stands at the forefront of real-time heart monitoring, providing patients with constant updates and alerts on their heart activity. This ongoing tracking not only aids in early detection of irregularities but also fosters a deeper understanding of heart health.
By integrating advanced ECG reporting into everyday health routines, Heartnet supports both patients and clinicians in making informed decisions. With continuous monitoring, even subtle changes in cardiac activity can be flagged, leading to timely consultations and interventions.
Conclusion
Understanding ECG reporting doesn’t require a medical degree—just curiosity and the right support system. With real-time heart monitoring solutions like those from Heartnet, patients are more informed, more involved, and better equipped to manage their cardiac health.
Whether you’re interpreting your first ECG or looking to stay ahead of potential heart issues, knowledge is power. Embracing these insights helps bridge the gap between technology and patient empowerment in today’s health-conscious world.


